Along with many other industries, the green industry experienced changes in the last few years. Since the 2008-2009 recession, the industry has shown signs of recovery, especially for some sectors. More recently, mitigation measures due to COVID-19 and mandatory business shutdowns are expected to contract revenues from landscaping services slightly until 2021; yet revenues are expected to rise in 2022. In addition, nurseries and garden stores reported increased revenue in 2020, despite the pandemic effect. The industry benefits from customers (residential and commercial) looking to make aesthetic upgrades to homes, yards, and spaces. Put simply, when homeowners and companies have more income, they will purchase more plants, services, and equipment from the green industry. These trends present important economic opportunities for the environmental horticulture, or green, industry.
Using data from the latest green industry survey, this publication characterizes the economic contributions of Indiana’s green industry in 2018. The findings in this report can help industry stakeholders, policymakers, and researchers and Extension personnel understand the structural and performance issues faced by businesses in the green industry. Findings can also help policymakers inform incentives and policies to have a more efficient allocation of resources. This publication categorizes the green industry in six sectors based on main revenue activity: greenhouse and nursery production; lawn and garden equipment manufacturing; farm, garden equipment, nursery, and florist wholesalers; lawn and garden equipment and supplies stores; florists; and landscape architecture and services. For more information, access the full report at purdue.ag/hortbusiness.
Main Findings
Indiana placed 20th in output contributions ($6.9 billion), 19th in job contribution (45,701 jobs), and 19th in value-added ($3.8 billion) in the U.S. Figure 1 illustrates the total and direct job contributions by sector. Landscape architecture and services generated most of the total (27,510) and direct (15,393) jobs in 2018, followed by stores (7,544 total and 4,052 direct jobs), wholesalers (5,030 total and 3,905 direct jobs), florists (2,272 total and 1,469 direct jobs), producers (1,947 total and 1,388 direct jobs), and manufacturers (1,398 total and 323 direct jobs). When comparing job contributions between wholesale and retail sectors, estimates show retail generated more total and direct employment at 9,816 and 5,521 jobs, respectively.
 Figure 1. Indiana green industry employment contributions, 2018.
Figure 2 illustrates the labor income contributions of the Indiana green industry by group of business. Labor income represents employee wages and benefits and business owner income. Landscape architecture and services generated 63% of labor income contributions, estimated at $1.5 billion, followed by stores ($344 million, 14%), wholesalers ($274 million, 11%), producers ($96 million, 4%), florists ($91 million, 4%), and manufacturers ($86 million, 4%).
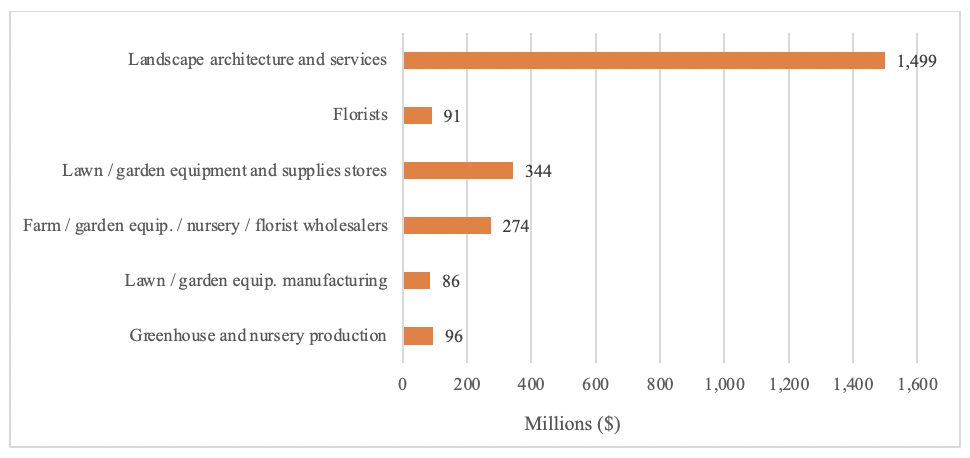 Figure 2. Indiana green industry labor income contributions, 2018.
Figure 3 shows the total and direct output contributions, as well as value-added contributions of the Indiana green industry in 2018. Output is equivalent to business sales revenue, and value-added is equivalent to Gross Domestic Product (GDP), including labor income, other property income (interest, rents, royalties, and corporate benefits) and business taxes. Similar to other contributions, the landscape architecture and services group generated the highest contribution in terms of output and value-added. To illustrate, the landscape architecture and services generated 61% and 65% of the total and direct sales estimated for the Indiana green industry in 2018. The other groups: stores (16% total and 13% of direct sales), wholesalers (9% total and 6% of direct sales), manufacturers (7% total and 6% of direct sales), producers (4% total and 9% of direct sales), and florists (3% total and 2% of direct sales). Similarly, landscape architecture and services generated the most value-added contributions at $2.2 billion, which represents 59% of all industry contributions in Indiana in 2018.
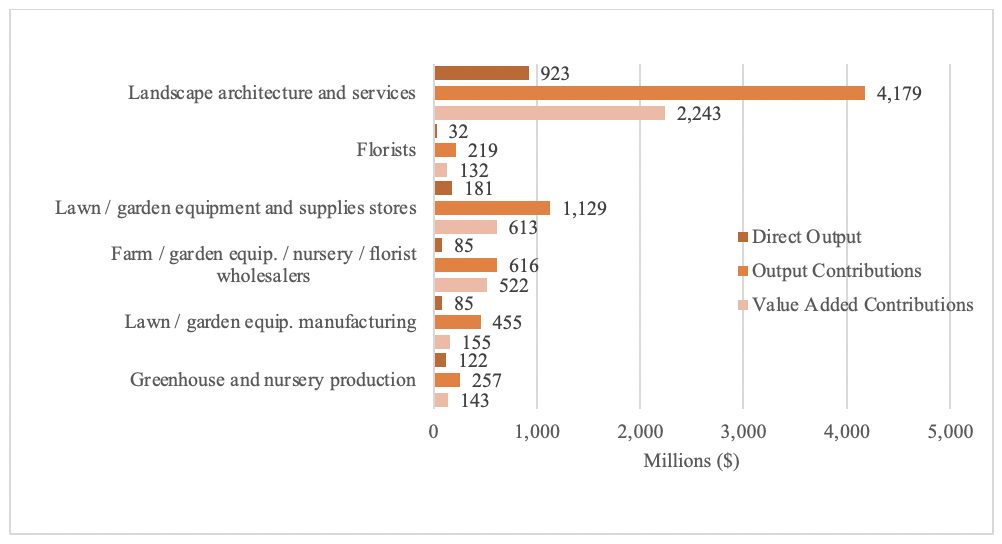 Figure 3. Indiana green industry output and value-added contributions, 2018.