This publication is the first of a series of articles aiming to assess the economic feasibility of growing sod. Publications can be found at the Purdue Education Store. This publication assesses the economic feasibility of growing Kentucky bluegrass in the Midwest by determining the financial costs and returns associated with one year of production. This publication addresses significant questions, such as: Is Kentucky bluegrass production profitable? What does it take in terms of financial means, to start producing Kentucky bluegrass? How do sod yield and price impact profitability? What is the breakeven price and yield of an average Kentucky bluegrass farm?
Turfgrass is a major specialty crop in the US. Data from the 2017 US Census of Agriculture showed that 1,500 sod farms generated $1.2 billion in sales from harvesting approximately 340,000 acres in 2017 (USDA-NASS, 2019). The turfgrass industry’s economic impact derives from the environmental, functional, and aesthetic benefits that sod provides to the landscaping sector and the strong demand from residential and commercial property development.
Data for this analysis comes from five sod farms, located in Indiana and Iowa; sod growers were interviewed to calculate average capital expenses, labor, variable, and fixed costs. Data was used to develop profitability projections, sensitivity analysis, and breakeven benchmarks based on the three states represented in our sample.
Take Home Message
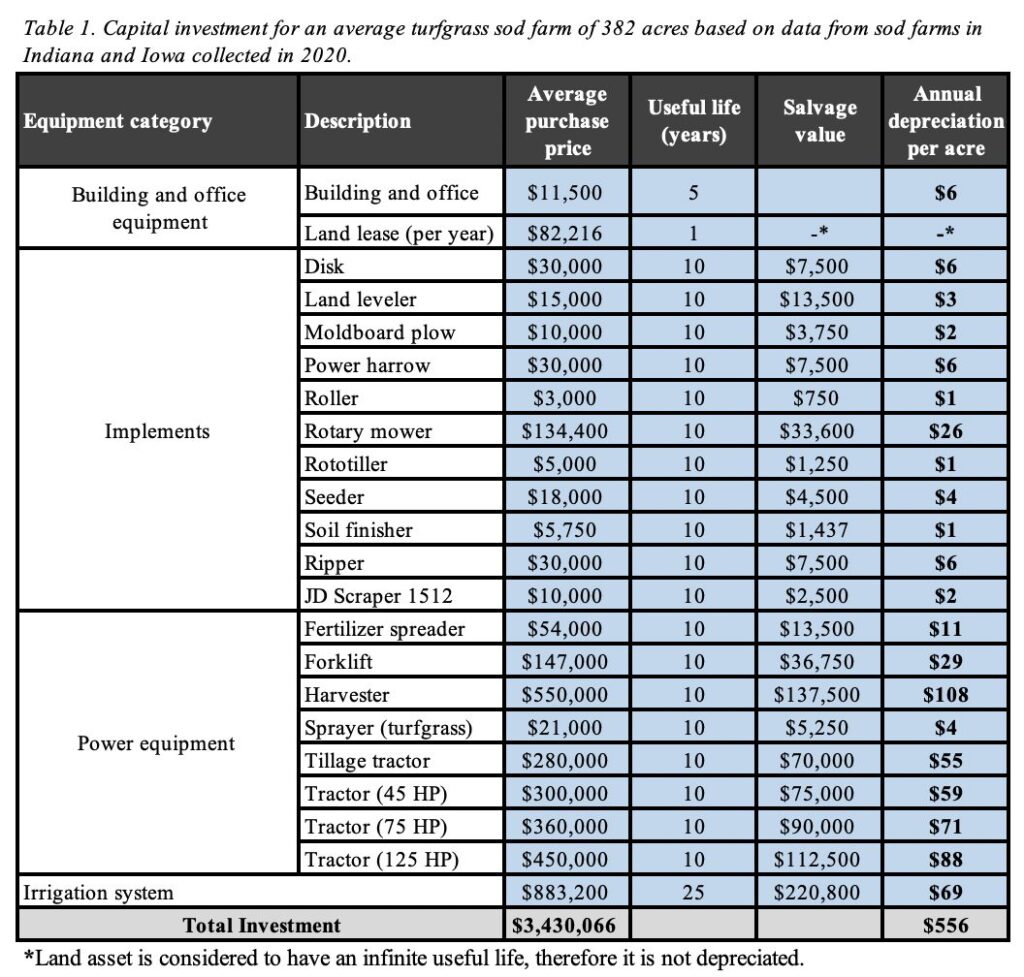
The initial investment for a turfgrass farm producing 382 acres of Kentucky bluegrass is $3,430,066. Investment includes buildings and office equipment, machinery, and irrigation system acquisition. If the operation yields around 41,130 ft2 of sod per acre, they can obtain a profit of $5,632 per acre when the average price is $0.26 per ft2. Labor costs represent 52% of total costs per acre, and the breakeven yield and price of Kentucky bluegrass is 19,468 ft2, and $0.12/ft2, respectively.
Capital Investment
Table 1 categorizes three main categories of capital investment in a sod farm: buildings and office equipment, implements and power equipment, and irrigation system.
Production Budget
The average production cycle was estimated at 12 months, ranging from 10 to 14 months. The average variable cost was estimated at $1,251 per acre, which included average expenses related to seed ($333), liming materials ($16), pesticides ($124), fertilizers ($127), fuel ($131), repair cost ($25), oil and filter ($62), and pallets ($433). Depending on the severity of weeds and insects invading the cultivar area, pesticides (herbicides, insecticides, and fungicides) costs will vary from one operation to another.
Sod farms reported hiring four types of workers: full-time, H2A, machine operators, and part-time workers. Many of the interviewed farmers preferred to hire machine operators who have repair and maintenance skills, allowing them to reduce costs associated with outsourced services. Total labor costs accounted for $1,017,938 per year, which was calculated from hiring an average of twenty employees in a typical sod farm. Labor costs included full-time workers ($415,430), H2A workers ($211,530), machine operators ($365,813), and part-time workers ($25,165).
Fixed costs are costs that must be paid regardless of the amount of sod harvested and sold. Fixed costs included expenses related to depreciation and overhead costs (advertising, employee benefits, insurance, interest, and taxes). Fixed costs reported by sod operators averaged $438,984 per year. Annual depreciation was included as a way to recover the purchase price of the assets acquired for the farm operations. Depreciation for power equipment and implements totaled $204,502, communication and advertising accounted for $9,189, while employee benefits were reported at $33,736. Other reported fixed costs included housing and insurance ($12,500), interest on loan ($127,500), and property taxes ($51,558).
Main Findings
An enterprise budget can assist farm-level decision-making. Understanding the crop profitability and how price, cost, and yield can change this bottom line can help sod farmers make economically feasible decisions. Using an enterprise budget for Kentucky bluegrass, this publication provides profitability, cost, sensitivity, and breakeven analysis to farmers growing Kentucky bluegrass in Indiana, Iowa and Tennessee. Data collected provide the economic feasibility of growing Kentucky bluegrass and serves as an economic benchmark for sod growers considering diversifying their crop mix.
A typical farmer generates $10,694 in sales and $5,062 in total costs, resulting in a net profit of $5,632 per acre. An average farm of 382 acres would generate a net profit of $2,153,674.
The cost structure analysis helps farmers get a peripheral view of the distribution of each cost category. Labor costs accounted for half of the total costs per acre (52%). Other costs reported were variable costs (25%) and fixed costs (23%). This analysis can be used to project how changes in investments (i.e., automated harvester) can impact cost structure.
A sensitivity analysis presents a “what-if” approach that measures how the net profit in a decision model will be affected by changes in price and yield. For example, the average selling price of sod is reported at $0.26/ft2, and the average yield reported is 41,130 ft2/acre. Therefore, if both conditions met, the net profit would be $5,632 per acre. Whereas, if yield drops by 2% and sod price drops by 20%, the net profit will decrease to $3,322 per acre. Alternatively, if only price increases by 10%, the net profit would increase to $6,701 per acre.
Enterprise budgets are useful for performing breakeven analysis on prices and yields. Breakeven yield analysis shows that to cover all the costs from an average operation, a sod farmer has to sell at least 19,468 ft2 of sod at $0.26 per ft2. Decreasing the selling price by 10% (at $0.23) can result in a new breakeven yield of 21,632 ft2 of sod. Lower prices may be a result of oversupply, supply chain disruptions, or an unexpected pandemic. In other words, a sod operation should at least sell 21,632 ft2 of sod if Kentucky bluegrass prices lower from 0.26 to 0.23 per ft2.
Breakeven price analysis showed the breakeven price at $0.12, which represents the minimum price that allows the farm to cover all projected costs. An unproductive year where yield decrease by 4% (39,485 ft2) and costs per acre increased by 10% (total costs at $5,568), the new breakeven price would be $0.14/ft2.